In previous blogs, we have talked about trying to get to race weight before. While training for his second Ironman, YJ MD Ryan looked at the best ways to go about gradually losing weight ahead of a big race while maintaining muscle mass, and avoiding the danger of ‘bouncing back’ common to many fad diets. What we didn’t talk about, is how to go about determining what that ideal race weight should be.

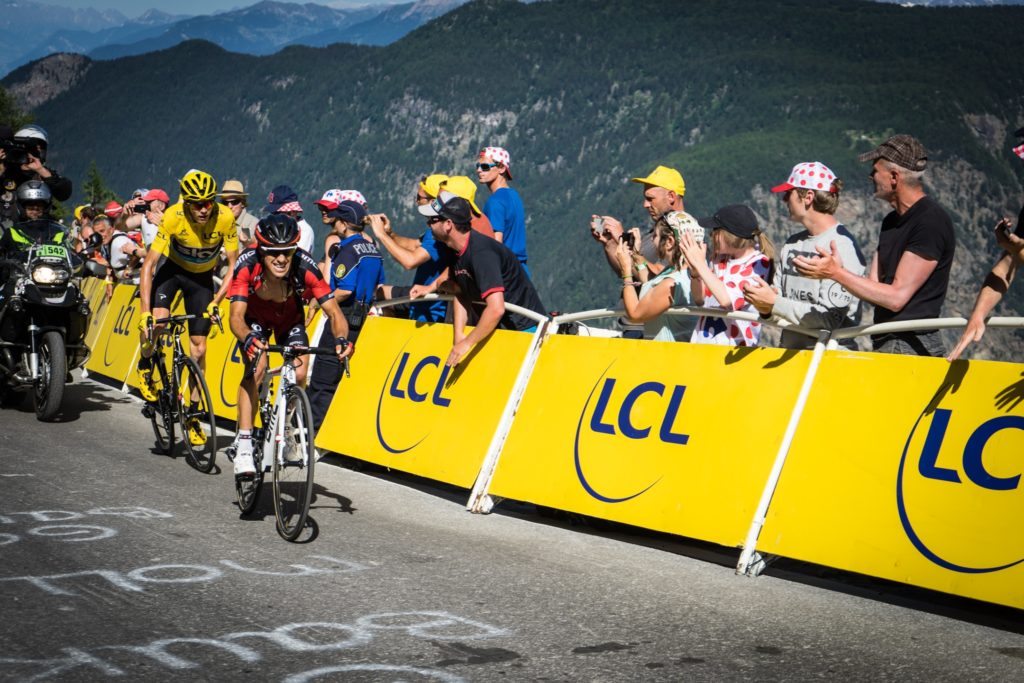
Chris Froome famously looked like a skeleton at the end of the the 2016 Tour de France, and has largely credited his career to this.
During the 2018 Giro d’Italia, Team Sky published data revealing the detail that went into the fuelling plan of Froome’s long-range attack over the Colle delle Finestre on stage 19. The information provided to the BBC, gives us an idea of Sky and Froome’s tactics in the last week of the Giro.
What is really interesting in relation to race weight is the team planned for him to lose weight as the race progressed.
Most riders would usually look to maintain or even gain weight over the course of a Grand Tour, but Froome was in fact aiming to lose weight in weeks one and two in order to hit his ideal race weight of 68.5kg for the final three mountain stages. He clearly had the benefit of meticulous nutrition planning but this is a very risky strategy indeed.
what about the rest of us?
As an amateur, maintaining a very low level of body fat all year round could be extremely unhealthy. If you are competing in shorter distance events (and let’s face it none of us are doing a 3 week Grand Tour), sacrificing muscle mass to simply have a lower race weight is only going to be a detriment to you. Training while on a very low calorie diet will also hamper your results.
Ideally your race weight should leave you in a sweet spot. If you’re too heavy you will be working unnecessarily hard. The excess fat won’t work for you, rather slow you down. If you’re too light, you may find that you’ve lost essential power and endurance despite the weight loss. Your power-to-weight ratio can be maximised by finding your best race weight.
why is race weight important?
Your race weight is so important because, according to Hunter Allen, founder of the Peaks Coaching Group and co-author of Training and Racing with a Power Meter, “every extra pound you carry above [your race weight] makes you 15 to 20 seconds slower for each mile of a climb.”
It is unlikely you will maintain race weight year round (that’s why it’s called race weight, derr); rather, it is a weight that you drop to during your competitive season. For some cyclists it is a period when they are particularly lean. Finding the perfect race weight for you may take some trial and error and is not an exact science, but we have some ways to help.
Kendra Wenzel who runs the blog ‘Get Faster’ looked at cyclists competing at an elite national or international level, then took an average of their weights compared to their heights. You can see the original post over on her website, but we’ve copied the data below converting it into kg’s for convenience.
| Height / Weight Range Approximations (in kg) | |||||||||
| Women | |||||||||
| Climber | Sprinter | ||||||||
| Height (cm) | Height (feet and inches) | Min | Max | Min | Max | ||||
| 157 | 5’2″ | 45 | 50 | 48 | 56 | ||||
| 160 | 5’3″ | 46 | 52 | 49 | 58 | ||||
| 163 | 5’4″ | 48 | 54 | 51 | 60 | ||||
| 165 | 5’5″ | 49 | 55 | 53 | 62 | ||||
| 168 | 5’6″ | 51 | 57 | 54 | 64 | ||||
| 170 | 5’7″ | 53 | 59 | 56 | 65 | ||||
| 173 | 5’8″ | 54 | 61 | 58 | 68 | ||||
| 175 | 5’9″ | 55 | 63 | 59 | 69 | ||||
| 178 | 5’10” | 57 | 64 | 61 | 72 | ||||
| 180 | 5’11” | 59 | 66 | 63 | 73 | ||||
| 183 | 6’0″ | 62 | 68 | 64 | 76 | ||||
| Men | |||||||||
| Climber | Sprinter | ||||||||
| Height (cm) | Height (feet and inches) | Min | Max | Min | Max | ||||
| 163 | 5’4″ | 50 | 59 | 55 | 64 | ||||
| 165 | 5’5″ | 51 | 62 | 57 | 66 | ||||
| 168 | 5’6″ | 52 | 64 | 59 | 68 | ||||
| 170 | 5’7″ | 54 | 67 | 61 | 70 | ||||
| 173 | 5’8″ | 55 | 67 | 63 | 73 | ||||
| 175 | 5’9″ | 57 | 68 | 64 | 75 | ||||
| 178 | 5’10” | 59 | 69 | 66 | 77 | ||||
| 180 | 5’11” | 61 | 70 | 68 | 79 | ||||
| 183 | 6’0″ | 63 | 73 | 69 | 81 | ||||
| 185 | 6’1″ | 65 | 78 | 72 | 83 | ||||
| 188 | 6’2″ | 65 | 80 | 73 | 85 | ||||
| 191 | 6’3″ | 67 | 82 | 75 | 88 | ||||
| 193 | 6’4″ | 68 | 84 | 77 | 90 | ||||
Table Source: Kendra Wenzel
Fat vs Muscle
Too much fat can be very dangerous for your health as well as bad news for your race time. The healthy levels of body fat are up to 25% for men and up to 30% for women (as women physiologically require a higher level of essential fat). Obviously, for athletes these levels and the ideal ranges are lower. Seriously low levels of body fat can be dangerous and hinder your performance though.
When we think of ‘weight loss’, it should rather be ‘fat loss’. Weight loss, as we think of with many diet plans, is usually caused by your body being sent into some degree of starvation mode due to the reduced calorie intake. Therefore, it sources its energy not only from your excess fat but also from your lean tissues – namely your hard-earned muscles.
Achieving your target race weight
Once you have decided on your target race weight, calculating your TDEE (Total Daily Energy Expenditure) is a good way of starting to work towards it. TDEE works out how many calories you use on a day to day basis – more on days you are training – so that you can work out how many to subtract to achieve steady and successful weight loss. By doing so, you can reduce your calories without negatively impacting on your training. Manipulating the macronutrient proportions of your food – for example, eating more protein as it keeps you fuller for longer – is another good way of shedding the excess fat in a healthy and sustainable way so that you are your healthiest and fittest come race day.
POWER-to-Weight Ratio
Power-to-weight ratio is a term regularly heard in cycling – especially by cyclists who find themselves struggling when climbing. It’s also a calculation that most Grand Tour teams place huge importance upon. Power-to-weight ratio is the maximum power output that can be produced in relation to body weight. Power-to-weight ratio matters because it helps predict performance.
For example: Cyclist 1 can sustain a power output of 300W while Cyclist 2 can only manage 250W. On a flat track, Cyclist 1 should be faster than Cyclist 2. Throw in some hills and unless they weigh the same the results may differ. If Cyclist 1 weighs 100kg and Cyclist 2 weighs 70kg, Cyclist 1 is not going to perform well on the hills.
Since power-to-weight ratio is a fairly simple formula power (watts) divided by mass (kg) (expressed as Watts per Kilo or W/Kg), it is very simple to work out that there are three ways to increase your power-to-weight ratio.
- Increase your power output and keep your race weight the same
- Keep your power output the same and decrease your race weight
- Increase your power and also decrease your race weight
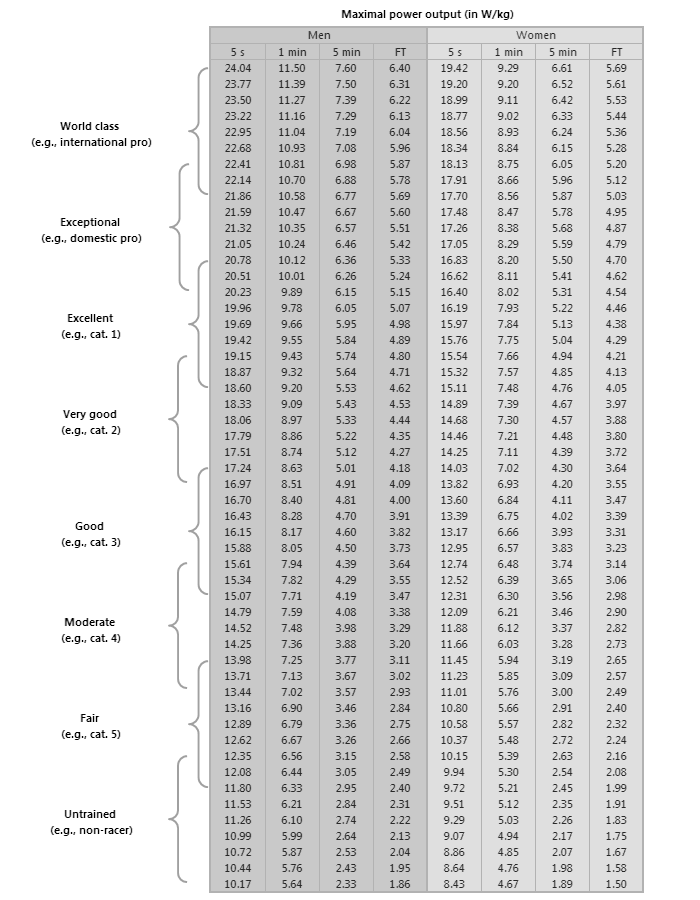
Below is a chart produced by the typical W/Kg cyclists are able to produce, grouping them into relative bands. FT stands for Functional Threshold (Power), also referred to FTP. This is typically calculated by your average wattage over a 20 minute max effort, then taking 95% of this figure. You may want to give this a go on a Watt Bike or turbo trainer to see what you FTP is. Many training plans are structured around your FTP as this a very useful way of measuring sustained efforts and serves as a comparable performance indicator for people of different shapes and sizes.

To put this into perspective, Alberto Contador recorded a whopping 7.4 w/kg over 20 minutes, an FTP of 7 w/kg! How do you compare?
Now you know whether you are a hill climber or sprinter, have a look at how we can protect your bikes with our completely comprehensive bicycle insurance.
